

question stringlengths 8 170 | answer stringlengths 1 90 | enhanced_prompt stringlengths 17 1.25k | enhanced_completion stringlengths 2 39.3k | reasoning_trace stringlengths 47 44.9k | chart_type stringclasses 7
values | difficulty stringclasses 3
values | id stringlengths 11 20 | notes stringlengths 25 100 | original_image stringlengths 103 112 | response_constraints stringlengths 980 1.2k | source stringclasses 2
values | split stringclasses 1
value | task_type stringclasses 10
values | verified bool 1
class |
|---|---|---|---|---|---|---|---|---|---|---|---|---|---|---|
哪个类别的销售额最低? | 服务 | 请分析提供的“Sales by Product Category”饼图,识别并指出销售额占比最低的类别。 | 根据“Sales by Product Category”饼图,销售额占比最低的类别是 **Services**,其占比为 **12.7%**。 | 我需要分析这个“Sales by Product Category”饼图,找出销售额占比最低的类别。首先,我会仔细观察图中的每个扇区及其对应的百分比数值。
图中显示了五个类别:
- Subscriptions: 30.3%
- Hardware: 25.4%
- Software: 16.9%
- Consulting: 14.8%
- Services: 12.7%
现在我来比较这些百分比数值,找出最小的那个。30.3%是最大的,然后是25.4%,接着是16.9%,14.8%,最后是12.7%。
12.7%是所有数值中最小的,对应的类别是Services。
让我再确认一下:Subscriptions 30.3% > Har... | pie | easy | syn_pie_0261__q2 | annotated pie; procedural gen (seed=46, idx=161); style=editorial | # Constraints
The question you must answer is from a data-analysis-visualization domain. You are a data analyst expert in interpreting visual reports. You have a keen eye for detail in charts and graphs, allowing you to quickly identify trends, minimums, and maximums within a dataset to provide accurate business insigh... | synthetic | train | max_min | true | |
Rank the top 3 verticals by revenue. | Utilities, Retail, Automotive | Analyze the provided bar chart titled "Annual Revenue by Vertical" and identify the top 3 verticals with the highest revenue. List them in descending order, including the specific revenue amount for each. | ### Step 1 — Compare
**Content accuracy & completeness:**
- Response 0: Accurate ranking (Utilities, Retail, Automotive), but lacks revenue amounts.
- Response 1: Fully accurate — correct verticals and exact revenue figures ($13,000, $11,800, $11,300). Matches chart data precisely.
- Response 2: Inaccurate — invents “... | I need to analyze the bar chart titled "Annual Revenue by Vertical" and identify the top 3 verticals with the highest revenue, listing them in descending order with their specific revenue amounts.
First, I'll scan all the bars to visually identify the tallest ones. The y-axis shows revenue in dollars, ranging from 0 t... | bar | hard | hard_many_0140__q2 | hard/many_categories; procedural gen (seed=777, idx=140); correct-by-construction; style=neutral | # Constraints
The question you must answer is from a data-analysis-visualization domain. You are a professional Data Analyst with expertise in business intelligence and data storytelling. You are skilled at interpreting quantitative information from charts and graphs to provide accurate rankings and insights. Your prec... | synthetic | train | rank_order | true | |
¿Cuál fue los ingresos de APAC en el tercer trimestre? | $9400 | Basado en el gráfico de barras adjunto titulado 'Revenue by Region', ¿cuál fue el valor de los ingresos para la región APAC en el tercer trimestre (Q3)? Por favor, proporcione la cifra exacta indicada en la barra correspondiente. | $9400 | El gráfico muestra ingresos por región y trimestre. La región APAC está en el extremo derecho. Dentro de APAC, hay tres barras: Q1, Q2 y Q3. La barra de Q3 es la tercera en el grupo, de color más claro según la leyenda. Sobre esa barra, el valor etiquetado es $9400. Ese es el dato exacto solicitado.
Answer: $9400 | grouped_bar | hard | hard_simcol_0193__q1 | hard/similar_colors; procedural gen (seed=777, idx=193); correct-by-construction; style=spreadsheet | # Constraints
The question you must answer is from a data-analysis-visualization domain. You are a business data analyst proficient in interpreting financial charts and bilingual in English and Spanish. You are ideally placed to answer because you can accurately extract specific data points from a grouped bar chart and... | synthetic | train | lookup_value | true | |
What was the revenue in Oct? | $6100 | Based on the provided chart titled 'Revenue and Conversion Rate', what was the revenue in Oct? | The revenue in October was $6100. | The chart displays revenue as blue bars with values labeled on top. For October ("Oct"), the bar has the value "6100" clearly marked above it. The left y-axis is labeled "Revenue ($)", confirming the unit. No conversion or estimation is needed since the exact value is provided directly on the chart.
Answer: $6100 | mixed | hard | hard_dual_0206__q3 | hard/dual_axis; procedural gen (seed=777, idx=206); correct-by-construction; style=dark | # Constraints
The question you must answer is from a data-analysis-visualization domain. You are a Data Analyst with a background in business intelligence. You are an expert at interpreting charts and dashboards to extract specific metrics, ensuring high accuracy when reading data labels and axes to provide precise bus... | synthetic | train | lookup_value | true | |
En 2023, quel segment a atteint son pic de revenus ? | PME | En 2023, quel segment a atteint son pic de revenus ? | En 2023, le segment SMB a atteint son pic de revenus avec 5800 $. | I need to find which segment had the highest revenue in 2023. Looking at the bar chart, I can see four segments: Enterprise, SMB, Consumer, and Startup. The blue bars represent 2023 data.
Let me check each segment's 2023 revenue:
- Enterprise: $3700
- SMB: $5800
- Consumer: $2900
- Startup: $3400
Comparing these valu... | grouped_bar | easy | syn_grouped_0268__q2 | annotated grouped bars; procedural gen (seed=44, idx=168); style=neutral | # Constraints
The question you must answer is from a data-analysis-visualization domain. You are a Business Intelligence Analyst with expertise in data visualization and financial reporting. You are skilled at interpreting bar charts to extract key performance indicators and trends. Your professional background allows ... | synthetic | train | max_min | true | |
Which vertical had the highest revenue? | Tech | Based on the provided bar chart titled 'Revenue by Vertical', identify which vertical category generated the highest revenue. The chart displays revenue in dollars ($) for the following verticals: Insurance, Construction, Energy, Utilities, and Tech. Please state the name of the vertical with the tallest bar. | Tech | I need to find the vertical with the highest revenue by looking at the bar chart titled "Revenue by Vertical". The y-axis shows revenue in dollars, ranging from 0 to 5000. I'll scan each bar from left to right: Insurance is around $3000, Construction is about $1000, Energy is roughly $2000, Utilities is approximately $... | bar | hard | hard_unlab_0253__q2 | hard/unlabeled; procedural gen (seed=777, idx=253); correct-by-construction; style=spreadsheet | # Constraints
The question you must answer is from a data-analysis-visualization domain. You are a Data Analyst with a background in business intelligence. You specialize in interpreting visual data representations and extracting key performance indicators. Your expertise allows you to quickly identify trends and outli... | synthetic | train | max_min | true | |
Which product sold the most units? | Widget A | Based on the provided bar chart titled 'Units Sold by Product', identify which product sold the highest number of units. The chart displays the following data points:
- Widget D: 15 units
- Widget F: 3000 units
- Widget A: 20000 units
- Widget B: 200 units
- Gizmo X: 200 units
Please state the name of the product wit... | Widget A sold the highest number of units at 20,000. | I need to identify which product sold the highest number of units based on the bar chart. The chart uses a logarithmic scale, but the actual values are labeled directly on top of each bar, so I don’t need to estimate from the axis.
Looking at the labels:
- Widget D: 15
- Widget F: 3000
- Widget A: 20000
- Widget B: 20... | bar | hard | hard_log_0169__q1 | hard/log_scale; procedural gen (seed=777, idx=169); correct-by-construction; style=bold | # Constraints
The question you must answer is from a data-analysis-visualization domain. You are a data analyst with expertise in interpreting visual data and charts. You are skilled at reading logarithmic scales and extracting quantitative information from business reports to provide accurate insights. Do not make ref... | synthetic | train | max_min | true | |
Quel segment a généré le chiffre d'affaires le plus élevé ? | Éducation | En vous basant sur le graphique fourni ci-dessous, identifiez le segment qui a généré le chiffre d'affaires le plus élevé au premier trimestre (Q1).
[Image: Q1 Revenue by Segment bar chart showing Mid-Market $9600, Nonprofit $10400, Education $10500, Consumer $9800, SMB $9900] | Le segment Education a généré le chiffre d'affaires le plus élevé au premier trimestre avec 10 500 $. | To determine which segment generated the highest revenue in Q1, I need to examine the bar chart titled “Q1 Revenue by Segment.” The chart displays five segments: Mid-Market, Nonprofit, Education, Consumer, and SMB. Each bar is labeled with its corresponding revenue value.
Looking at the values:
- Mid-Market: $9600
- N... | bar | hard | hard_trunc_0216__q1 | hard/truncated_axis; procedural gen (seed=777, idx=216); correct-by-construction; style=dark | # Constraints
The question you must answer is from a data-analysis-visualization domain. You are a Business Intelligence Analyst specializing in data visualization. You are an expert at interpreting financial charts and extracting key performance indicators to provide clear, accurate business insights. You are ideally ... | synthetic | train | max_min | true | |
Was Government's revenue higher in 2023 or 2024? | 2024 | Based on the provided bar chart titled '2023-2024 Revenue by Segment', determine whether the Government segment's revenue was higher in 2023 or in 2024. Provide the specific revenue values for both years to support your answer. | The Government segment's revenue was higher in 2024, with $4,300 compared to $3,600 in 2023. | I need to analyze the bar chart to compare Government segment revenue between 2023 and 2024. Looking at the chart, I can see grouped bars for each segment with blue representing 2023 and pink representing 2024. For the Government category, the blue bar (2023) shows $3600 and the pink bar (2024) shows $4300. Since 4300 ... | grouped_bar | medium | syn_grouped_0336__q3 | annotated grouped bars; procedural gen (seed=44, idx=236); style=pastel | # Constraints
The question you must answer is from a data-analysis-visualization domain. You are a data analyst specializing in business intelligence. You have a keen eye for interpreting charts and extracting specific metrics from visual data. You are ideally placed to answer because you can accurately compare values ... | synthetic | train | multi_series_compare | true | |
How many more units did Widget E sell than Widget C? | 2100 | Based on the provided bar chart titled 'Q1 Units Sold by Product', calculate the difference in units sold between Widget E and Widget C. Specifically, subtract the number of units sold for Widget C from the number of units sold for Widget E to determine how many more units Widget E sold. | Widget E sold 5400 units and Widget C sold 3300 units. The difference is 5400 - 3300 = 2100.
Answer: 2100 | I need to find the units sold for Widget E and Widget C from the bar chart, then subtract Widget C’s value from Widget E’s to get the difference. Looking at the chart, Widget E’s bar reaches 5400 — that’s clearly labeled above the bar. Widget C’s bar is labeled 3300. So I’ll compute 5400 minus 3300. That gives me 2100.... | bar | medium | syn_bar_0242__q3 | annotated bars; procedural gen (seed=42, idx=142); style=pastel | # Constraints
The question you must answer is from a data-analysis-visualization domain. You are a Business Intelligence Analyst experienced in data interpretation. You possess a keen eye for extracting quantitative insights from charts and performing precise calculations to support business decision-making. Do not mak... | synthetic | train | delta_absolute | true | |
Quel segment a généré le chiffre d'affaires total le plus faible ? | Éducation | En vous basant sur le graphique fourni, analysez les données pour déterminer quel segment a généré le chiffre d'affaires total le plus faible. Additionnez les revenus des trois niveaux de produits (Basic, Standard et Pro) pour chaque segment afin de justifier votre réponse.
[Image du graphique : Revenue by Segment: Pr... | Le segment **Education** a généré le chiffre d’affaires total le plus faible.
Calculs par segment :
- **Consumer** : 3500 + 3400 + 2100 = **9000 $**
- **Education** : 500 + 2000 + 2300 = **4800 $**
- **SMB** : 700 + 2900 + 3100 = **6700 $**
- **Enterprise** : 3200 + 1700 + 3400 = **8300 $**
Le total de 4800 $ pour Ed... | Je dois analyser ce graphique en barres empilées pour trouver le segment avec le revenu total le plus faible. Le graphique montre quatre segments : Consumer, Education, SMB et Enterprise. Chaque barre est divisée en trois niveaux de produits : Basic (bleu), Standard (orange) et Pro (vert).
Je vais additionner les reve... | stacked_bar | medium | syn_stacked_0283__q2 | annotated stacked bars; procedural gen (seed=45, idx=183); style=neutral | # Constraints
The question you must answer is from a data-analysis-visualization domain. You are a Business Intelligence Analyst with expertise in data visualization. You are skilled at interpreting stacked bar charts to extract key performance indicators and financial insights. Your precision in quantitative analysis ... | synthetic | train | max_min | true | |
¿Cuál fue la diferencia de ingresos entre Medios y Finanzas? | $500 | Basado en el gráfico de barras proporcionado, determine la diferencia de ingresos entre el sector de Medios y el sector de Finanzas.
**Instrucciones:**
1. Identifique el valor de ingresos para la categoría 'Media'.
2. Identifique el valor de ingresos para la categoría 'Finance'.
3. Calcule la diferencia numérica entre... | La diferencia de ingresos entre el sector de Medios ($9700) y el sector de Finanzas ($9200) es de $500. | El gráfico muestra los ingresos por vertical para el Q3. Identifico que la barra de Media tiene un valor de $9700 y la de Finance es $9200. Resto 9200 de 9700 para obtener la diferencia.
Answer: $500 | bar | medium | syn_bar_0118__q3 | annotated bars; procedural gen (seed=42, idx=18); style=minimal | # Constraints
The question you must answer is from a data-analysis-visualization domain. You are a Business Intelligence Analyst experienced in interpreting corporate financial charts. You excel at extracting specific data points from visualizations and performing quick quantitative calculations to provide accurate bus... | synthetic | train | delta_absolute | true | |
What was the conversion rate in Sep? | 7.6% | Based on the provided chart titled 'Revenue and Conversion Rate', what was the conversion rate in September? | **Step 1 — Compare**
- **Content accuracy & completeness**:
- Response 0 and Response 3 both claim the September conversion rate is 8%, but this misreads the chart — the red dot above “Sep” is labeled “7.6”, not “8”.
- Response 1 correctly identifies the value as 7.8% — however, this is also inaccurate; the la... | I need to find the conversion rate for September from the chart. The chart has two y-axes: left for Revenue ($) and right for Conversion Rate (%). The red line with dots represents the conversion rate, and each dot is labeled with its value. I’ll locate “Sep” on the x-axis, then look up to the red dot above it. The lab... | mixed | hard | hard_dual_0089__q1 | hard/dual_axis; procedural gen (seed=777, idx=89); correct-by-construction; style=bold | # Constraints
The question you must answer is from a data-analysis-visualization domain. You are a data analyst specializing in business intelligence. You are an expert at interpreting dual-axis charts and extracting specific metrics from visual data representations to provide accurate business insights. Do not make re... | synthetic | train | lookup_value | true | |
Entre el Q1 y el Q2, ¿cuál tuvo mayores ingresos para Manufactura? | Q2 | Analiza el gráfico de barras adjunto titulado "Revenue by Vertical: Q1 vs Q2". Compara los ingresos del sector "Manufacturing" entre el primer trimestre (Q1) y el segundo trimestre (Q2) para determinar cuál de los dos periodos tuvo mayores ingresos. Proporciona la respuesta indicando el trimestre ganador y los valores ... | En el sector "Manufacturing", los ingresos de Q1 fueron $10,900 y los de Q2 fueron $11,900. Por lo tanto, el trimestre ganador es Q2. | Voy a analizar el gráfico para comparar los ingresos del sector "Manufacturing" entre Q1 y Q2. Primero, localizo la categoría "Manufacturing" en el eje X, que es la última barra a la derecha. Observo las dos barras correspondientes: la azul (Q1) y la rosa (Q2).
Leo los valores directamente de las etiquetas de datos so... | grouped_bar | medium | syn_grouped_0406__q3 | annotated grouped bars; procedural gen (seed=44, idx=306); style=pastel | # Constraints
The question you must answer is from a data-analysis-visualization domain. You are a business data analyst fluent in Spanish. You specialize in interpreting financial charts and KPIs to provide clear, accurate summaries of corporate performance. Your expertise allows you to quickly extract specific values... | synthetic | train | multi_series_compare | true | |
¿Qué equipo generó más ingresos? | Omega | Basado en el gráfico de barras titulado 'Q2 Revenue by Team' que se muestra a continuación, identifica qué equipo generó la mayor cantidad de ingresos. Proporciona el nombre del equipo y la cifra exacta de ingresos mostrada en la etiqueta superior de su barra.
[Gráfico: Q2 Revenue by Team]
- Omega: $7100
- Beta: $5400... | El equipo Omega generó la mayor cantidad de ingresos, con una cifra exacta de $7100. | El gráfico muestra los ingresos del segundo trimestre por equipo. Observo las barras y sus etiquetas superiores: Omega tiene $7100, Beta $5400, Theta $5300 y Epsilon $6600 (nota: el prompt dice $6400 pero la imagen muestra $6600 — debo confiar en la imagen). Comparando los valores, $7100 es el más alto. Por lo tanto, O... | bar | easy | syn_bar_0373__q2 | annotated bars; procedural gen (seed=42, idx=273); style=bold | # Constraints
The question you must answer is from a data-analysis-visualization domain. You are a Data Analyst with expertise in business intelligence. You are skilled at interpreting visual data representations, such as bar charts, to extract key performance indicators and provide accurate comparative insights for co... | synthetic | train | max_min | true | |
How many units did SKU-203 sell? | 500 | Analyze the provided bar chart titled 'Weekly Units Sold by SKU' and determine the number of units sold for the specific product identifier 'SKU-203'.
**Chart Data:**
- **Title:** Weekly Units Sold by SKU
- **Y-Axis:** Units sold (Scale: 0 to 2500)
- **X-Axis Categories & Values:**
- SKU-208: 2500
- SKU-203: 500
... | Based on the chart, the bar for SKU-203 reaches the 500 mark on the y-axis, confirmed by the data label above the bar.
Answer: 500 | I need to find the number of units sold for SKU-203 from the bar chart. Looking at the x-axis, I locate the category labeled "SKU-203". The corresponding bar rises to a height that aligns with the 500 mark on the y-axis. Additionally, there is a data label directly above the bar that explicitly states "500". This confi... | bar | easy | syn_bar_0231__q1 | annotated bars; procedural gen (seed=42, idx=131); style=academic | # Constraints
The question you must answer is from a data-analysis-visualization domain. You are a Data Analyst with expertise in business intelligence. You are skilled at interpreting visual data representations like bar charts to extract specific metrics, making you ideal for accurately reading values from a chart to... | synthetic | train | lookup_value | true | |
Did Referral have a bigger share of traffic than Social? | Yes | Based on the provided pie chart titled 'Website Traffic Sources', determine whether the 'Referral' category has a larger percentage share of traffic than the 'Social' category. Compare the numerical values associated with each slice to answer the question. | Yes, the 'Referral' category (27.1%) has a larger share than the 'Social' category (14.5%). | I need to compare the percentage values for 'Referral' and 'Social' from the pie chart. Looking at the chart, I can see 'Referral' is labeled with 27.1% and 'Social' is labeled with 14.5%. Since 27.1 is greater than 14.5, 'Referral' has a larger share. The question asks for a yes/no determination based on this comparis... | pie | medium | syn_pie_0128__q3 | annotated pie; procedural gen (seed=46, idx=28); style=pastel | # Constraints
The question you must answer is from a data-analysis-visualization domain. You are a Data Analyst specializing in digital marketing metrics. You have extensive experience interpreting visual data representations like pie charts to derive business insights. Your expertise allows you to accurately compare q... | synthetic | train | compare_categories | true | |
La part de revenus de l'APAC était-elle plus importante que celle de l'Amérique latine ? | Non | En vous basant sur le graphique intitulé "Regional Revenue Share" fourni ci-dessous, comparez les pourcentages de revenus des régions APAC et LATAM. La part de revenus de l'APAC était-elle plus importante que celle de l'Amérique latine ?
[Graphique : Pie Chart - Regional Revenue Share]
- EMEA: 9.2%
- NA: 23.8%
- LATAM... | La part de revenus de l'APAC est de 20,8 %, tandis que celle de l'Amérique latine (LATAM) est de 23,4 %. Puisque 20,8 % est inférieur à 23,4 %, la part de l'APAC n'est pas plus importante. | Je dois comparer les pourcentages de revenus entre APAC et LATAM à partir du graphique en camembert. Je vois que APAC est à 20,8 % et LATAM à 23,4 %. La question demande si APAC est plus important que LATAM — clairement, 20,8 < 23,4, donc non. Je dois répondre en français, court et direct, sans mentionner mon rôle. Je ... | pie | medium | syn_pie_0337__q3 | annotated pie; procedural gen (seed=46, idx=237); style=academic | # Constraints
The question you must answer is from a data-analysis-visualization domain. You are a business data analyst with expertise in interpreting financial visualizations. You are skilled at extracting specific metrics from charts and performing quantitative comparisons to provide accurate business insights. Do n... | synthetic | train | compare_categories | true | |
What was the revenue in Dec? | $5900 | Based on the provided chart titled "Revenue and Conversion Rate", what was the revenue in Dec? | The revenue in Dec was $5900. | I need to find the revenue for December from the chart. The chart has two y-axes: left is Revenue ($), right is Conversion Rate (%). Blue bars represent revenue, orange line is conversion rate. I’m looking for the blue bar labeled “Dec” on the x-axis. The bar for Dec has a value label directly on top: 5900. Since the l... | mixed | hard | hard_dual_0215__q3 | hard/dual_axis; procedural gen (seed=777, idx=215); correct-by-construction; style=dense | # Constraints
The question you must answer is from a data-analysis-visualization domain. You are a Data Analyst with expertise in business intelligence. You have a keen eye for detail and are skilled at extracting specific metrics from complex charts to provide accurate reporting for business stakeholders. Do not make ... | synthetic | train | lookup_value | true | |
¿Cuál fue la tasa de conversión en diciembre? | 5,0 % | Basándote en el gráfico proporcionado, ¿cuál fue la tasa de conversión en diciembre? | **Step 1 — Compare**
- **Content accuracy & completeness**:
Response 0 states 5.1%, which is incorrect — the chart clearly labels December’s conversion rate as 5.0%.
Responses 1, 2, and 3 correctly identify the value as 5.0% (or 5%). Response 1 provides context (“punto de la línea roja sobre el eje de diciembr... | El gráfico combina un gráfico de barras para los ingresos y un gráfico de líneas para la tasa de conversión. La pregunta se refiere a la tasa de conversión, que corresponde a la línea roja y al eje derecho. Al observar el eje horizontal en la etiqueta "Dec" (diciembre), el punto de datos en la línea roja tiene una etiq... | mixed | hard | hard_dual_0269__q1 | hard/dual_axis; procedural gen (seed=777, idx=269); correct-by-construction; style=bold | # Constraints
The question you must answer is from a data-analysis-visualization domain. You are a Data Analyst specializing in business intelligence. You have extensive experience interpreting combined chart types, such as bar and line graphs, to extract key performance indicators. You are ideally placed to answer bec... | synthetic | train | lookup_value | true | |
哪个渠道的支出占比最小? | SEO | 请分析提供的“Marketing Spend by Channel”环形图,识别并指出哪个营销渠道的支出占比最小。 | 根据“Marketing Spend by Channel”环形图数据,各渠道支出占比分别为:Social (30.1%)、Affiliate (26.1%)、Paid Search (22.2%)、Email (14.4%)、SEO (7.2%)。其中,SEO 的支出占比最小,为 7.2%。 | 我需要分析这个环形图,找出支出占比最小的营销渠道。首先观察图表中的各个扇区及其对应的百分比数值。
从图中可以看到:
- Social: 30.1%
- Affiliate: 26.1%
- Paid Search: 22.2%
- Email: 14.4%
- SEO: 7.2%
比较这些数值,7.2% 是最小的百分比,对应的是 SEO 渠道。其他渠道的占比都明显高于这个数值。
Answer: SEO | donut | easy | syn_donut_0158__q2 | annotated donut; procedural gen (seed=46, idx=340); style=neutral | # Constraints
The question you must answer is from a data-analysis-visualization domain. You are a data analyst with expertise in business intelligence and marketing metrics. You specialize in interpreting visual data representations like donut charts to extract actionable insights. Your precision and attention to deta... | synthetic | train | max_min | true | |
What was Telecom's revenue? | $8000 | Based on the provided bar chart titled 'Revenue by Vertical', what is the revenue value for the 'Telecom' category? | Based on the bar chart titled 'Revenue by Vertical', the revenue value for the 'Telecom' category is **$8000**. | I need to find the revenue for the 'Telecom' category from the bar chart. First, I locate the 'Telecom' label on the x-axis — it’s the fourth bar from the left. Then I look at the height of that bar relative to the y-axis, which is labeled “Revenue ($)” and ranges from 0 to 9000 in increments of 1000. The top of the Te... | bar | hard | hard_unlab_0217__q1 | hard/unlabeled; procedural gen (seed=777, idx=217); correct-by-construction; style=academic | # Constraints
The question you must answer is from a data-analysis-visualization domain. You are a data analyst with expertise in business intelligence. You are skilled at interpreting quantitative data from visual charts and graphs to provide accurate financial insights. Your professional precision ensures that values... | synthetic | train | lookup_value | true | |
Which segment had the highest revenue? | Startup | Analyze the provided bar chart titled 'Q1 Revenue by Segment' to determine which segment generated the highest revenue. Identify the segment with the tallest bar and state its name along with the corresponding revenue value shown on the chart. | The **Startup** segment generated the highest revenue in Q1, with a value of **$12000**, as shown by the tallest bar on the chart. | Looking at the bar chart titled "Q1 Revenue by Segment", I need to identify which segment has the highest revenue. The chart displays five segments: Startup, Consumer, Enterprise, SMB, and Education. Each bar’s height corresponds to its revenue value in dollars, as indicated on the y-axis labeled “Revenue ($)”.
I scan... | bar | hard | hard_trunc_0027__q1 | hard/truncated_axis; procedural gen (seed=777, idx=27); correct-by-construction; style=academic | # Constraints
The question you must answer is from a data-analysis-visualization domain. You are a Business Intelligence Analyst with expertise in data visualization. You are skilled at interpreting charts and graphs to extract key performance indicators and business insights, making you ideal for accurately identifyin... | synthetic | train | max_min | true | |
What was Gamma's revenue? | $2300 | Based on the provided bar chart titled 'Q3 Revenue by Team', what was the revenue for the team named 'Gamma'? Please provide the specific dollar amount shown on the chart. | The revenue for the team named 'Gamma' is $2300. | I need to find the revenue for the team named 'Gamma' from the bar chart titled 'Q3 Revenue by Team'. I'll scan the x-axis labels to locate 'Gamma'. Once found, I'll look at the corresponding bar and read the value labeled on top of it. The bar for Gamma has a label that reads "$2300". This is the exact dollar amount s... | bar | easy | syn_bar_0151__q1 | annotated bars; procedural gen (seed=42, idx=51); style=academic | # Constraints
The question you must answer is from a data-analysis-visualization domain. You are a Business Intelligence Analyst experienced in data storytelling and reporting. You specialize in extracting precise quantitative information from visual charts and dashboards to support corporate financial reviews. Your ap... | synthetic | train | lookup_value | true | |
How much total revenue did LATAM generate? | $6300 | Based on the provided chart titled 'Revenue by Region: Product Breakdown', calculate the total revenue generated by the LATAM region. To do this, identify the revenue values for each product category (Software, Services, and Hardware) within the LATAM bar and sum them together. | To calculate the total revenue for the LATAM region, sum the values for each product category shown in its bar:
- Software: $2600
- Services: $1600
- Hardware: $2100
Total = $2600 + $1600 + $2100 = **$6300** | The chart is a stacked bar chart showing revenue by region, broken down by product: Software (dark gray), Services (black), and Hardware (light gray). For LATAM, I need to extract the three labeled values from its bar.
Looking at the LATAM bar:
- Bottom segment (Software): labeled $2600
- Middle segment (Services): la... | stacked_bar | medium | syn_stacked_0120__q3 | annotated stacked bars; procedural gen (seed=45, idx=20); style=academic | # Constraints
The question you must answer is from a data-analysis-visualization domain. You are a Business Intelligence Analyst with expertise in data visualization and financial reporting. You are skilled at interpreting stacked bar charts and performing quantitative aggregations to derive business insights from visu... | synthetic | train | aggregation_sum_avg | true | |
En Actual, ¿qué canal tuvo los ingresos más bajos? | Marketplace | Basándote en el gráfico proporcionado, identifica qué canal de ventas tuvo los ingresos más bajos en la categoría 'Actual' (representada por las barras rojas). Indica el nombre del canal y el valor numérico correspondiente. | El canal con los ingresos más bajos en la categoría 'Actual' es Marketplace, con un valor de $3700. | Necesito identificar el canal de ventas con los ingresos más bajos en la categoría 'Actual', que está representada por las barras rojas en el gráfico.
Primero, voy a examinar cada canal y su valor correspondiente en la categoría 'Actual' (barras rojas):
- Marketplace: $3700
- Wholesale: $7600
- Direct: $4500
- Resell... | grouped_bar | easy | syn_grouped_0287__q2 | annotated grouped bars; procedural gen (seed=44, idx=187); style=bold | # Constraints
The question you must answer is from a data-analysis-visualization domain. You are a Business Intelligence Analyst with expertise in data visualization. You specialize in interpreting corporate performance charts to extract actionable insights, making you ideal for accurately identifying specific data poi... | synthetic | train | max_min | true | |
SKU-201 比 SKU-208 多出多少单位? | 900 | 根据提供的图表,计算 SKU-201 比 SKU-208 多销售多少个单位? | 根据图表,SKU-201 的销量为 1400 个单位,SKU-208 的销量为 500 个单位。两者相差 1400 - 500 = 900 个单位。 | Looking at the bar chart titled "Weekly Units Sold by SKU", I need to find the sales figures for SKU-201 and SKU-208. The chart displays four bars, each labeled with its corresponding SKU number on the x-axis and the exact number of units sold above each bar.
Locating SKU-201, I see the bar reaches a height labeled "1... | bar | medium | syn_bar_0291__q3 | annotated bars; procedural gen (seed=42, idx=191); style=academic | # Constraints
The question you must answer is from a data-analysis-visualization domain. You are a business data analyst with expertise in interpreting visual reports and performing quantitative calculations. You are skilled at extracting specific values from charts and performing arithmetic to provide accurate busines... | synthetic | train | delta_absolute | true | |
Le chiffre d'affaires a-t-il augmenté ou diminué de mars à avril ? | Augmenté | En vous basant sur le graphique fourni, le chiffre d'affaires a-t-il augmenté ou diminué entre mars et avril ? | Le chiffre d'affaires a augmenté entre mars et avril, passant de 8 600 $ à 9 100 $. | Le graphique montre les revenus mensuels pour le premier semestre 2025. En mars, le chiffre d'affaires est de 8 600 $, et en avril, il atteint 9 100 $. La différence indique une hausse.
Answer: Augmenté | line | easy | syn_line_0228__q3 | annotated line; procedural gen (seed=43, idx=128, trend=down); style=minimal | # Constraints
The question you must answer is from a data-analysis-visualization domain. You are a data analyst with expertise in business intelligence. You are skilled at interpreting visual data representations and trends to provide accurate financial insights. You have a keen eye for detail and can quickly translate... | synthetic | train | trend_direction | true | |
إيرادات دلتا؟ | 2700 دولار | استنادًا إلى الرسم البياني المرفق بعنوان "Monthly Revenue by Team"، ما هي قيمة الإيرادات (بالدولار) الخاصة بفريق "Delta"؟ | قيمة الإيرادات لفريق "Delta" هي $2700. | أرى أن الرسم البياني يعرض إيرادات شهرية حسب الفريق، والمطلوب هو قيمة إيرادات فريق "Delta". أنظر إلى العمود المخصص لـ "Delta" في الرسم، وألاحظ أن هناك تسمية مباشرة فوق العمود تشير إلى القيمة. القيمة المكتوبة هي $2700. لا حاجة لتقدير من المحور لأن القيمة موضحة بوضوح. الإجابة المباشرة والدقيقة هي ما يُطلب.
Answer: $2700 | bar | easy | syn_bar_0211__q1 | annotated bars; procedural gen (seed=42, idx=111); style=academic | # Constraints
The question you must answer is from a data-analysis-visualization domain. You are a data analyst experienced in interpreting business reports. You are skilled at extracting specific quantitative values from visual charts and presenting them accurately. Your approach is precise and focused on delivering t... | synthetic | train | lookup_value | true | |
Quelle part du trafic Direct représentait-il ? | 4,9 % | En vous basant sur le graphique fourni, quelle est la part du trafic représentée par la source "Direct" ? | La part du trafic représentée par la source "Direct" est de 4,9 %. | Je regarde le graphique en camembert intitulé "Website Traffic Sources". Je repère la section étiquetée "Direct", qui est colorée en rose pâle et située entre "Social" et "Referral". À l’intérieur de cette section, la valeur numérique est clairement indiquée : 4,9%. La question demande la part du trafic pour "Direct", ... | pie | easy | syn_pie_0128__q1 | annotated pie; procedural gen (seed=46, idx=28); style=pastel | # Constraints
The question you must answer is from a data-analysis-visualization domain. You are a Data Analyst specializing in digital marketing. You are an expert at interpreting visual data representations, such as pie charts, to extract specific metrics and KPIs. Your precision and familiarity with website traffic ... | synthetic | train | lookup_value | true | |
What was Q2's total revenue? | $6400 | Based on the provided chart titled 'Revenue by Quarter and Channel', calculate the total revenue for Q2 by summing the values of its three segments: Organic, Paid, and Referral. | To calculate the total revenue for Q2, sum the values of its three segments: $2100 (Organic) + $2600 (Paid) + $1700 (Referral) = $6400. | To find the total revenue for Q2, I need to locate the bar labeled "Q2" on the x-axis and sum the values of its three stacked segments. Looking at the chart, the Q2 bar shows three distinct sections with their respective values labeled: the bottom blue section (Organic) is $2100, the middle red section (Paid) is $2600,... | stacked_bar | medium | syn_stacked_0335__q3 | annotated stacked bars; procedural gen (seed=45, idx=235); style=salmon | # Constraints
The question you must answer is from a data-analysis-visualization domain. You are a Data Analyst with expertise in business intelligence and financial reporting. You are skilled at interpreting stacked bar charts and performing quantitative aggregations to extract precise insights from corporate revenue ... | synthetic | train | aggregation_sum_avg | true | |
What was the percent change in revenue from Sep to Dec? | 14.8% | Based on the provided chart titled 'Revenue by Month — H2 2024', calculate the percent change in revenue from September to December. Please show your work by identifying the revenue values for both months and applying the percentage change formula. | September Revenue: $6100
December Revenue: $7000
Percent Change = $\frac{7000 - 6100}{6100} \times 100 = \frac{900}{6100} \times 100 \approx 14.75\%$
Answer: 14.75% | I need to calculate the percent change in revenue from September to December using the chart titled “Revenue by Month — H2 2024”. First, I’ll locate the revenue values for both months. Looking at the chart, September’s data point is labeled $6100, and December’s is labeled $7000.
Now, applying the percent change form... | line | medium | syn_line_0216__q4 | annotated line; procedural gen (seed=43, idx=116, trend=flat); style=salmon | # Constraints
The question you must answer is from a math domain. You are a financial analyst with expertise in quantitative data interpretation. You are skilled at extracting values from charts and performing precise percentage change calculations to provide business insights. Do not make reference to your persona, jo... | synthetic | train | percent_change_ratio | true | |
How many more units did Widget F sell than Widget B? | 50 | Based on the provided bar chart titled 'Units Sold by Product', calculate the difference in sales volume between 'Widget F' and 'Widget B'. Specifically, determine how many more units Widget F sold compared to Widget B by subtracting the value of Widget B from the value of Widget F. | Based on the bar chart, Widget F sold 11,900 units and Widget B sold 11,850 units. The difference in sales volume is calculated as 11,900 - 11,850 = 50 units.
Answer: 50 | I need to find the difference in sales between Widget F and Widget B using the bar chart. First, I locate Widget F on the x-axis — it’s the third bar from the left. The value labeled above it is 11900. Then I find Widget B — second bar from the left — with a labeled value of 11850. Since the question asks how many more... | bar | hard | hard_tie_0255__q3 | hard/near_tie; procedural gen (seed=777, idx=255); correct-by-construction; style=dense | # Constraints
The question you must answer is from a data-analysis-visualization domain. You are a Business Intelligence Analyst experienced in interpreting data visualizations. You possess a keen eye for extracting precise values from charts and performing accurate quantitative comparisons to provide actionable busine... | synthetic | train | delta_absolute | true | |
哪个渠道占据了支出主导地位? | 付费搜索 | 请分析提供的“Marketing Spend by Channel”图表,确定哪个渠道占据了支出主导地位。请列出该渠道的名称及其对应的百分比数值。 | 支出主导地位的渠道是 Paid Search,占比 29.5%。 | Looking at the donut chart titled "Marketing Spend by Channel", I need to identify which segment represents the largest portion of spending. The chart is divided into four colored sections, each labeled with a channel name and a percentage.
I’ll scan each segment:
- Social: 23.8% (red)
- SEO: 21.9% (blue)
- Display: 2... | donut | easy | syn_donut_0188__q2 | annotated donut; procedural gen (seed=46, idx=370); style=neutral | # Constraints
The question you must answer is from a data-analysis-visualization domain. You are a data analyst specializing in business intelligence. You have extensive experience interpreting visual data representations like donut charts to extract key performance indicators. Your expertise allows you to accurately i... | synthetic | train | max_min | true | |
H1 和 H2 中,哪个在 MEA 地区的收入更高? | H1 | 请根据提供的图表数据,比较 MEA 地区在 H1(上半年)和 H2(下半年)的收入数值,并明确指出哪个时间段的收入更高。
图表数据如下:
- 标题:Revenue by Region: H1 vs H2
- 图例:蓝色代表 H1,橙色代表 H2
- MEA 地区数据:
- H1(蓝色柱):$5100
- H2(橙色柱):$4700 | MEA 地区 H1 收入为 $5100,H2 收入为 $4700,H1 收入更高。
Answer: H1 | 我需要比较 MEA 地区在 H1 和 H2 的收入。从图表中可以看到,MEA 对应的蓝色柱(H1)标注为 $5100,橙色柱(H2)标注为 $4700。直接比较这两个数值,5100 大于 4700,因此 H1 收入更高。问题要求明确指出哪个时间段收入更高,答案应为“H1”。
Answer: H1 | grouped_bar | medium | syn_grouped_0373__q3 | annotated grouped bars; procedural gen (seed=44, idx=273); style=dense | # Constraints
The question you must answer is from a data-analysis-visualization domain. You are a Business Intelligence Analyst experienced in interpreting financial charts and reports. You are skilled at extracting specific data points from visualizations and providing accurate comparisons to support business decisio... | synthetic | train | multi_series_compare | true | |
How much Basic revenue did Government contribute? | $3100 | Based on the provided chart titled 'Revenue by Segment: Product Tier Breakdown', determine the revenue amount generated by the 'Basic' product tier specifically for the 'Government' segment. | The revenue generated by the 'Basic' product tier for the 'Government' segment is $3100. | I need to find the revenue for the 'Basic' tier in the 'Government' segment. Looking at the chart, I see four stacked bars representing different segments: SMB, Education, Consumer, and Government. The legend indicates that 'Basic' is represented by the blue color at the bottom of each stack. For the Government segment... | stacked_bar | medium | syn_stacked_0379__q1 | annotated stacked bars; procedural gen (seed=45, idx=279); style=dark | # Constraints
The question you must answer is from a data-analysis-visualization domain. You are a Business Intelligence Analyst experienced in data visualization. You are skilled at interpreting stacked bar charts and extracting specific metrics to provide accurate financial insights for corporate reporting. Do not ma... | synthetic | train | lookup_value | true | |
From Sep to Oct, did users increase or decrease? | Increased | Based on the provided chart titled 'Active Users by Month — H2 2024', analyze the trend between September and October. Specifically, did the number of active users increase or decrease during this period? | The number of active users increased from 12,400 in September to 15,300 in October.
Answer: Increased | I need to analyze the trend between September and October based on the chart titled 'Active Users by Month — H2 2024'. First, I'll locate the data points for these two months. Looking at the x-axis, I can see September (Sep) and October (Oct) are clearly labeled.
For September, the data point shows 12,400 active user... | line | easy | syn_line_0210__q3 | annotated line; procedural gen (seed=43, idx=110, trend=up); style=dark | # Constraints
The question you must answer is from a data-analysis-visualization domain. You are a Data Analyst experienced in business intelligence and reporting. You specialize in interpreting visual trends from charts and graphs to provide accurate quantitative insights. Your precision and ability to translate visua... | synthetic | train | trend_direction | true | |
教育行业的收入比非营利组织多多少? | 1400 美元 | 根据提供的图表“Q3 Revenue by Segment”,请计算教育行业(Education)的收入比非营利组织(Nonprofit)多多少?
图表数据如下:
- Nonprofit: $9000
- SMB: $9800
- Startup: $9900
- Enterprise: $9600
- Education: $10400 | 教育行业(Education)的收入为 $10400,非营利组织(Nonprofit)的收入为 $9000。两者之差为 $10400 - $9000 = $1400。
Answer: $1400 | 我需要计算教育行业收入与非营利组织收入的差值。从图表中可以看到,Education 的收入是 $10400,Nonprofit 的收入是 $9000。直接用 10400 减去 9000 得到 1400。题目要求以美元形式呈现,所以结果是 $1400。
Answer: $1400 | bar | hard | hard_trunc_0009__q2 | hard/truncated_axis; procedural gen (seed=777, idx=9); correct-by-construction; style=bold | # Constraints
The question you must answer is from a data-analysis-visualization domain. You are a data analyst specializing in business intelligence. You have a keen eye for interpreting visual data from charts and performing precise quantitative comparisons. You are ideally placed to answer because you can accurately... | synthetic | train | delta_absolute | true | |
من يوليو إلى أغسطس، هل زادت الإيرادات أم انخفضت؟ | زادت | بناءً على الرسم البياني المرفق بعنوان "Monthly Revenue – H2 2024"، قم بتحليل البيانات الخاصة بشهري يوليو وأغسطس. هل زادت الإيرادات أم انخفضت خلال هذه الفترة؟ | زادت الإيرادات من 5400 دولار في يوليو إلى 6100 دولار في أغسطس. | أرى أن الرسم البياني يعرض الإيرادات الشهرية للفترة من يوليو إلى ديسمبر 2024. أحتاج إلى تحليل شهري يوليو وأغسطس فقط كما طُلب في السؤال.
بالنظر إلى نقطة يوليو، أجد أن القيمة المسجلة هي 5400 دولار. ثم أنتقل إلى نقطة أغسطس وأجد أن القيمة هي 6100 دولار.
بمقارنة القيمتين: 6100 أكبر من 5400، وهذا يعني أن هناك زيادة في الإير... | line | easy | syn_line_0248__q3 | annotated line; procedural gen (seed=43, idx=148, trend=up); style=minimal | # Constraints
The question you must answer is from a data-analysis-visualization domain. You are a data analyst with expertise in financial reporting. You are skilled at interpreting line charts and extracting trends from visual data. You provide clear, concise answers based on the quantitative evidence presented in th... | synthetic | train | trend_direction | true | |
按收入对最后三个行业进行排名。 | 金融、科技、能源 | 请根据图表中的数据,按收入从高到低对最后三个行业(Retail、Energy、Finance)进行排名。 | 根据图表数据,最后三个行业(Retail、Energy、Finance)按收入从高到低排名为:Retail ($11000)、Energy ($10400)、Finance ($3000)。 | 我需要从图表中提取最后三个行业的收入数据:Retail、Energy 和 Finance。首先看 Retail 的柱子,顶部标注是 $11000;Energy 的柱子顶部标注是 $10400;Finance 的柱子顶部标注是 $3000。现在按收入从高到低排序:11000 > 10400 > 3000,所以顺序是 Retail、Energy、Finance。用户要求用中文回复,且要简短。
Answer: Retail、Energy、Finance | bar | medium | syn_bar_0310__q4 | annotated bars; procedural gen (seed=42, idx=210); style=dark | # Constraints
The question you must answer is from a data-analysis-visualization domain. You are a business data analyst experienced in interpreting financial dashboards. You have a keen eye for extracting quantitative values from charts and organizing them logically. You are ideally placed to answer because you can ac... | synthetic | train | rank_order | true | |
Revenue for Online? | $4100 | Based on the provided bar chart titled 'H2 Revenue by Channel', what is the revenue amount for the 'Online' channel? | The revenue for the 'Online' channel is $4100. | I need to find the revenue amount for the 'Online' channel from the bar chart titled 'H2 Revenue by Channel'. I'll scan the x-axis to locate the 'Online' category. Once found, I'll look at the corresponding bar and read the value labeled on top of it. The bar for 'Online' has a clear data label showing $4100. That’s th... | bar | easy | syn_bar_0149__q1 | annotated bars; procedural gen (seed=42, idx=49); style=dense | # Constraints
The question you must answer is from a data-analysis-visualization domain. You are a Business Intelligence Analyst experienced in interpreting financial dashboards. You have a keen eye for extracting specific data points from charts to support corporate reporting. You are ideally placed to answer because ... | synthetic | train | lookup_value | true | |
哪款产品的销量最高? | Widget F | 根据提供的图表,哪款产品的销量最高? | 根据图表,销量最高的产品是 Widget F,销量为 11900 个单位。 | 我需要找出销量最高的产品。首先,我浏览图表中的所有条形,观察它们的高度。每个条形上方都有具体的数值标注,这很方便,不需要我从坐标轴估算。
Gizmo X 是 8400。
Widget B 是 11850。
Widget F 是 11900。
Widget C 是 7700。
Widget A 是 9900。
现在比较这些数字:11900 是最大的数值。对应的产品标签是 "Widget F"。
题目问的是“哪款产品”,所以我只需要给出产品名称。为了完整,我也可以提一下销量数值,但核心答案是产品名。
检查是否有其他产品接近:Widget B 是 11850,非常接近,但 11900 确实更高。
所以,销量最高的是 Widget... | bar | hard | hard_tie_0255__q1 | hard/near_tie; procedural gen (seed=777, idx=255); correct-by-construction; style=dense | # Constraints
The question you must answer is from a data-analysis-visualization domain. You are a data analyst with a keen eye for detail and experience in business intelligence. You specialize in interpreting visual data representations to provide clear, accurate insights. You are ideally placed to answer this becaus... | synthetic | train | max_min | true | |
For Nonprofit, in which period was revenue highest? | Q2 | Analyze the provided line chart titled 'Revenue Trend by Segment' to answer the following question:
For the 'Nonprofit' segment, in which period (Q1, Q2, Q3, or Q4) was the revenue highest? | Q2 | To determine when the 'Nonprofit' segment had the highest revenue, I need to trace the specific line associated with that category. Looking at the legend, 'Nonprofit' corresponds to the black line with circular markers.
I will follow the black line across the four quarters:
- In Q1, the revenue is approximately $5,500... | line | hard | hard_crowd_0114__q1 | hard/crowded_legend; procedural gen (seed=777, idx=114); correct-by-construction; style=minimal | # Constraints
The question you must answer is from a data-analysis-visualization domain. You are a professional data analyst with expertise in interpreting business intelligence dashboards. You possess a keen eye for detail in reading line charts and extracting specific data points to provide accurate business insights... | synthetic | train | max_min | true | |
Was NA's revenue higher in H1 or H2? | H1 | Based on the provided bar chart titled 'Revenue by Region: H1 vs H2', determine whether the North America (NA) region generated higher revenue in the first half (H1) or the second half (H2) of the year. Please identify the specific revenue figures for both periods to support your answer. | North America (NA) generated higher revenue in the first half (H1) at $7100, compared to $3600 in the second half (H2).
Answer: H1 | I need to analyze the bar chart titled "Revenue by Region: H1 vs H2" to determine whether North America (NA) had higher revenue in H1 or H2. First, I’ll locate the NA section on the x-axis — it’s the third group of bars from the left. The legend indicates that the lighter gray bar represents H1 and the darker black bar... | grouped_bar | medium | syn_grouped_0285__q3 | annotated grouped bars; procedural gen (seed=44, idx=185); style=academic | # Constraints
The question you must answer is from a data-analysis-visualization domain. You are a Business Data Analyst with expertise in interpreting financial charts and reports. You have a keen eye for detail and a professional sensibility for translating visual data into clear, accurate business insights, making y... | synthetic | train | multi_series_compare | true | |
Quel secteur a généré le plus de revenus ? | Services publics | En vous basant sur le graphique fourni ci-dessous, identifiez le secteur qui a généré le plus de revenus annuels.
[Graphique : Annual Revenue by Vertical]
- Axe Y : Revenue ($)
- Axe X : Sectors (Energy, Construction, Telecom, Tech, Healthcare, Agriculture, Finance, Automotive, Insurance, Manufacturing, Logistics, Hos... | Le secteur ayant généré le plus de revenus annuels est Utilities, avec un total de $14 300, comme indiqué par la barre la plus haute sur le graphique. | Je regarde le graphique "Annual Revenue by Vertical". L'axe Y représente les revenus en dollars, et l'axe X liste les différents secteurs. Chaque barre bleue correspond à un secteur, avec une valeur numérique affichée au-dessus.
Je dois identifier le secteur avec le plus de revenus annuels, donc je cherche la barre la... | bar | hard | hard_many_0230__q1 | hard/many_categories; procedural gen (seed=777, idx=230); correct-by-construction; style=neutral | # Constraints
The question you must answer is from a data-analysis-visualization domain. You are a business data analyst with expertise in interpreting financial charts. You possess a keen eye for quantitative detail and can efficiently extract insights from visual data representations to support corporate decision-mak... | synthetic | train | max_min | true | |
Was Affiliate's share of spend larger than Social's? | Yes | Based on the provided pie chart titled 'Marketing Spend by Channel', determine whether the percentage of spend allocated to the 'Affiliate' channel is greater than the percentage allocated to the 'Social' channel. Please provide a direct answer supported by the specific values shown in the chart. | Yes, the percentage of spend allocated to the 'Affiliate' channel (32.9%) is greater than the percentage allocated to the 'Social' channel (13.4%). | I need to compare the spend percentages for 'Affiliate' and 'Social' channels from the pie chart. First, I locate the 'Affiliate' slice — it’s the large blue section labeled 32.9%. Then I find the 'Social' slice — it’s the light cyan section labeled 13.4%. Comparing the two: 32.9% is clearly greater than 13.4%. The que... | pie | medium | syn_pie_0205__q3 | annotated pie; procedural gen (seed=46, idx=105); style=dense | # Constraints
The question you must answer is from a data-analysis-visualization domain. You are a data analyst with a specialization in marketing intelligence. You excel at interpreting visual data representations and performing comparative quantitative analysis to provide business insights. Your precision and ability... | synthetic | train | compare_categories | true | |
How much total revenue did LATAM generate? | $8500 | Based on the provided chart titled 'Regional Revenue by Product', calculate the total revenue generated by the LATAM region. To do this, sum the revenue values for all product categories (Basic, Pro, and Premium) shown in the LATAM column. | To calculate the total revenue for the LATAM region, sum the values for each product category: $2700 (Basic) + $2700 (Pro) + $3100 (Premium) = $8500. | I need to find the total revenue for the LATAM region from the stacked bar chart. Looking at the LATAM column, I can see three segments representing different product categories. The bottom segment (Basic, dark gray) is labeled $2700. The middle segment (Pro, orange) is also labeled $2700. The top segment (Premium, tea... | stacked_bar | medium | syn_stacked_0117__q3 | annotated stacked bars; procedural gen (seed=45, idx=17); style=minimal | # Constraints
The question you must answer is from a data-analysis-visualization domain. You are a Business Intelligence Analyst experienced in interpreting corporate financial dashboards. You are skilled at extracting specific data points from stacked bar charts and performing the necessary aggregations to provide acc... | synthetic | train | aggregation_sum_avg | true | |
What was the Direct revenue for Q1? | $3600 | Based on the provided chart titled 'Quarterly Revenue by Channel', what was the Direct revenue for Q1? | **Step 1 — Compare**
- **Content accuracy & completeness**:
All responses correctly identify the Direct revenue for Q1 as $3600, matching the black segment in the Q1 bar. Response 0 and 3 provide context (legend, bar position), which adds clarity without error. Response 1 is accurate but minimal. Response 2 is tec... | I need to find the Direct revenue for Q1 from the stacked bar chart. First, I’ll locate the Q1 bar — it’s the rightmost one. The legend tells me that “Direct” is represented by the black segment. In the Q1 bar, the black segment is at the bottom, and it has a data label of $3600 written inside it. Since the question as... | stacked_bar | medium | syn_stacked_0302__q1 | annotated stacked bars; procedural gen (seed=45, idx=202); style=bold | # Constraints
The question you must answer is from a data-analysis-visualization domain. You are a Business Intelligence Analyst with expertise in data visualization. You are skilled at interpreting stacked bar charts and extracting specific financial metrics accurately to support business decision-making. Do not make ... | synthetic | train | lookup_value | true | |
بكم تتجاوز إيرادات بيتا إيرادات زيتا؟ | 2200 دولار | بناءً على الرسم البياني المرفق بعنوان "Monthly Revenue by Team"، أجب عن السؤال التالي:
بكم تتجاوز إيرادات بيتا إيرادات زيتا؟ | 2200 دولار | أرى أن الرسم البياني يعرض الإيرادات الشهرية لكل فريق. إيرادات فريق بيتا هي 5600 دولار، وإيرادات فريق زيتا هي 3400 دولار. لحساب الفرق، أطرح 3400 من 5600، مما يعطيني 2200. إذن، إيرادات بيتا تتجاوز إيرادات زيتا بمقدار 2200 دولار.
Answer: $2200 | bar | medium | syn_bar_0415__q3 | annotated bars; procedural gen (seed=42, idx=315); style=editorial | # Constraints
The question you must answer is from a data-analysis-visualization domain. You are a business data analyst experienced in interpreting financial charts and performing quantitative comparisons. You possess a keen eye for detail in data visualization and the mathematical skill to accurately calculate varian... | synthetic | train | delta_absolute | true | |
What was Q2's total revenue? | $8900 | Based on the provided chart titled 'Quarterly Revenue by Channel', calculate the total revenue for Q2 by summing the values of all channels (Direct, Partner, and Marketplace) for that quarter. | The total revenue for Q2 is $8900, calculated by summing the channel values: Direct ($3600) + Partner ($1500) + Marketplace ($3800). | I need to find the total revenue for Q2 from the stacked bar chart. First, I locate the Q2 bar on the x-axis. Then I identify the three segments of that bar corresponding to Direct, Partner, and Marketplace channels using the legend. Each segment has a labeled value: Direct is $3600 (bottom, darkest gray), Partner is $... | stacked_bar | medium | syn_stacked_0140__q3 | annotated stacked bars; procedural gen (seed=45, idx=40); style=academic | # Constraints
The question you must answer is from a data-analysis-visualization domain. You are a business data analyst with expertise in interpreting financial charts and visualizations. You have a keen eye for detail and a professional sensibility for corporate reporting. You are ideally placed to answer this becaus... | synthetic | train | aggregation_sum_avg | true | |
哪个季度的总收入最高? | 第二季度 | 根据提供的图表,请确定哪个季度的总收入最高。 | 根据图表数据计算各季度总收入:
- Q3:约 $6,000
- Q2:$4,300 + $2,900 + $3,300 = $10,500
- Q1:$1,500 + $3,900 + $4,100 = $9,500
- Q4:约 $5,200
Q2 的总收入最高。 | 我需要确定哪个季度的总收入最高。图表显示的是按渠道划分的季度收入,每个季度的柱子由三个部分组成:Direct(蓝色)、Partner(粉色)和Marketplace(绿色)。
让我计算每个季度的总收入:
Q3:从图表看,Direct约$1200,Partner部分较小,Marketplace标注为$4200。总和约$6000。
Q2:Direct标注为$4300,Partner标注为$2900,Marketplace标注为$3300。总和 = $4300 + $2900 + $3300 = $10500。
Q1:Direct标注为$1500,Partner标注为$3900,Marketplace标注为$4100。总和 = $... | stacked_bar | medium | syn_stacked_0341__q2 | annotated stacked bars; procedural gen (seed=45, idx=241); style=pastel | # Constraints
The question you must answer is from a data-analysis-visualization domain. You are a business data analyst with expertise in interpreting financial charts. You are skilled at aggregating stacked bar chart data to derive totals and identifying trends in quarterly revenue performance. Do not make reference ... | synthetic | train | max_min | true | |
Between Apr and May, did users increase or decrease? | Increased | Based on the provided chart titled 'Monthly Active Users — H1 2024', determine whether the number of active users increased or decreased between the months of April and May. | The number of active users increased from 20,200 in April to 21,800 in May.
Answer: Increased | I need to determine the trend in active users between April and May from the line chart. First, I locate April on the x-axis and find its corresponding data point — it’s labeled 20200. Then I move to May, which is next, and see its value is 21800. Comparing the two: 21800 is greater than 20200, so the number of users w... | line | easy | syn_line_0394__q3 | annotated line; procedural gen (seed=43, idx=294, trend=down); style=neutral | # Constraints
The question you must answer is from a data-analysis-visualization domain. You are a Data Analyst with experience in business intelligence. You are skilled at interpreting line charts and extracting trends from quantitative data to provide clear, accurate insights for stakeholders. Do not make reference t... | synthetic | train | trend_direction | true | |
Did Affiliate have a bigger share of spend than Paid Search? | No | Based on the provided pie chart titled 'Marketing Spend by Channel', determine whether the 'Affiliate' channel has a larger percentage share of the total marketing spend compared to the 'Paid Search' channel. Please compare the specific percentage values labeled for each segment to support your answer. | No, the 'Affiliate' channel (6.8%) has a smaller percentage share than the 'Paid Search' channel (15.2%). | I need to compare the percentage shares of "Affiliate" and "Paid Search" from the pie chart. First, I locate the "Affiliate" segment — it’s labeled 6.8%. Then I find "Paid Search" — that’s 15.2%. Since 6.8% is less than 15.2%, Affiliate does not have a larger share. The question asks for a direct comparison with specif... | pie | medium | syn_pie_0170__q3 | annotated pie; procedural gen (seed=46, idx=70); style=neutral | # Constraints
The question you must answer is from a data-analysis-visualization domain. You are a data analyst specializing in marketing performance. You have a keen eye for interpreting visual data representations like pie charts and can accurately compare quantitative values to provide business insights. Do not make... | synthetic | train | compare_categories | true | |
في أي فترة كان معدل التحويل أعلى؟ | الربع الثاني | بالنظر إلى الرسم البياني المرفق بعنوان "Revenue and Conversion Rate"، حدد الفترة الزمنية (الربع السنوي) التي سجلت أعلى معدل تحويل (Conversion Rate). يرجى ذكر اسم الربع والقيمة التقريبية للمعدل. | **Step 1 — Compare**
* **Content accuracy & completeness**:
* **Response 0** is accurate regarding the quarter (Q2) but fails to provide the specific value requested in the prompt.
* **Response 1** correctly identifies Q2 and estimates the value as 7.8%. It explains the derivation based on the right axis... | أحتاج إلى تحديد الربع الذي سجل أعلى معدل تحويل من الرسم البياني. الرسم يوضح إيرادات (أعمدة زرقاء) ومعدل تحويل (خط وردي) على محورين مختلفين.
أبحث عن النقطة الأعلى في الخط الوردي الذي يمثل معدل التحويل.
- في Q1، النقطة منخفضة جداً، حوالي 4.2%.
- في Q2، النقطة هي الأعلى بوضوح، تقع فوق خط 7.5% مباشرة. بالتقدير البصري، تبد... | mixed | hard | hard_dual_0098__q2 | hard/dual_axis; procedural gen (seed=777, idx=98); correct-by-construction; style=pastel | # Constraints
The question you must answer is from a data-analysis-visualization domain. You are a Data Analyst with expertise in business intelligence and performance tracking. You are skilled at interpreting dual-axis charts to extract key performance indicators (KPIs) like conversion rates and revenue. You provide p... | synthetic | train | max_min | true | |
¿Cuántas unidades más vendió el Widget F que el Widget D? | 4600 | Basado en el gráfico "Q4 Units Sold by Product", ¿cuántas unidades más vendió el Widget F que el Widget D? | 4600 | El gráfico muestra las unidades vendidas por producto en el cuarto trimestre. Widget F vendió 5300 unidades y Widget D vendió 700 unidades. La diferencia es 5300 - 700 = 4600.
Answer: 4600 | bar | medium | syn_bar_0278__q3 | annotated bars; procedural gen (seed=42, idx=178); style=minimal | # Constraints
The question you must answer is from a data-analysis-visualization domain. You are a Business Intelligence Analyst with expertise in data interpretation and reporting. You are skilled at extracting quantitative information from visual charts to provide accurate business insights. Your precision in calcula... | synthetic | train | delta_absolute | true | |
What was the Organic revenue for Q1? | $1500 | Based on the provided chart titled 'Revenue by Quarter and Channel', what was the Organic revenue for Q1? | The Organic revenue for Q1 is $1500. | I need to find the Organic revenue for Q1 from the stacked bar chart. First, I locate the bar labeled “Q1” on the x-axis. Then, I look at the legend to identify which color represents “Organic” — it’s the red segment at the bottom of each stack. In the Q1 bar, the red segment has a data label clearly showing “$1500”. S... | stacked_bar | medium | syn_stacked_0134__q1 | annotated stacked bars; procedural gen (seed=45, idx=34); style=editorial | # Constraints
The question you must answer is from a data-analysis-visualization domain. You are a Business Intelligence Analyst specializing in data visualization. You have extensive experience interpreting stacked bar charts and financial reports to extract specific KPIs. Your precision and attention to detail make y... | synthetic | train | lookup_value | true | |
De la S5 a la S6, ¿los registros aumentaron o disminuyeron? | Sin cambios | Observa el gráfico proporcionado. ¿Los registros (signups) aumentaron o disminuyeron de la semana 5 (W5) a la semana 6 (W6)?
<chart>
[Image of a line chart titled 'Weekly Signups — Q1' showing data points: W1=600, W2=800, W3=800, W4=900, W5=1100, W6=1100, W7=1100, W8=1200]
</chart> | Los registros se mantuvieron constantes en 1100 de la semana 5 a la semana 6; no hubo aumento ni disminución. | Looking at the chart, I need to compare the signup values for week 5 (W5) and week 6 (W6). The data point for W5 is labeled as 1100, and the data point for W6 is also labeled as 1100. Since both values are identical, there was no change between these two weeks — the number of signups remained the same. The line connect... | line | easy | syn_line_0227__q3 | annotated line; procedural gen (seed=43, idx=127, trend=flat); style=spreadsheet | # Constraints
The question you must answer is from a data-analysis-visualization domain. You are a Data Analyst with expertise in business intelligence. You are skilled at interpreting line charts and trends to provide accurate quantitative insights. Your precision and ability to translate visual data into clear busine... | synthetic | train | trend_direction | true | |
How much more revenue did Wholesale generate than Marketplace? | $5000 | Based on the provided bar chart titled 'H2 Revenue by Channel', calculate the difference in revenue between the Wholesale and Marketplace channels.
1. Identify the revenue value for the 'Wholesale' channel.
2. Identify the revenue value for the 'Marketplace' channel.
3. Subtract the Marketplace revenue from the Wholes... | Wholesale revenue is $8000 and Marketplace revenue is $3000. The difference is $8000 - $3000 = $5000.
Answer: $5000 | I need to find the revenue for Wholesale and Marketplace from the bar chart. Looking at the chart, the Wholesale bar has a label of $8000 on top. The Marketplace bar shows $3000. To find the difference, I subtract Marketplace from Wholesale: 8000 minus 3000 equals 5000. The question asks how much more revenue Wholesale... | bar | medium | syn_bar_0395__q3 | annotated bars; procedural gen (seed=42, idx=295); style=editorial | # Constraints
The question you must answer is from a data-analysis-visualization domain. You are a Business Intelligence Analyst experienced in data storytelling. You are skilled at extracting quantitative values from visual charts and performing comparative calculations to provide accurate business insights. Do not ma... | synthetic | train | delta_absolute | true | |
Did signups increase or decrease from W3 to W4? | Decreased | Based on the provided chart titled "Weekly Signups — Q4", determine whether the number of signups increased or decreased from Week 3 (W3) to Week 4 (W4). Provide the specific signup values for both weeks to support your conclusion. | Signups decreased from 800 in W3 to 700 in W4. | Looking at the chart titled "Weekly Signups — Q4", I need to compare the signup values for Week 3 (W3) and Week 4 (W4).
First, I locate W3 on the x-axis. The data point for W3 is labeled with the value 800. Then I move to W4 on the x-axis. The data point for W4 is labeled with the value 700.
Comparing these two valu... | line | easy | syn_line_0343__q3 | annotated line; procedural gen (seed=43, idx=243, trend=flat); style=bold | # Constraints
The question you must answer is from a data-analysis-visualization domain. You are a Data Analyst with a keen eye for detail and experience in business reporting. You are skilled at interpreting line charts and extracting specific data points to identify trends. Your sensibility is precise and objective, ... | synthetic | train | trend_direction | true | |
What was the signup count in W5? | 600 | Based on the provided chart titled 'Signups by Week — Q2', what was the signup count for Week 5 (W5)? | Based on the chart, the signup count for Week 5 (W5) is 600. | I need to find the signup count for Week 5 (W5) from the line chart titled "Signups by Week — Q2". Looking at the x-axis, I can see the weeks labeled W1 through W8. I locate W5 on the horizontal axis and follow it up to the data point on the line. The data point for W5 has a label directly above it showing "600". I can... | line | easy | syn_line_0171__q1 | annotated line; procedural gen (seed=43, idx=71, trend=down); style=academic | # Constraints
The question you must answer is from a data-analysis-visualization domain. You are a Data Analyst with a keen eye for detail. You specialize in interpreting charts and graphs to extract specific metrics, making you ideal for accurately reading data points from a visualization to provide precise answers. D... | synthetic | train | lookup_value | true | |
按收入对前 3 个垂直领域进行排名。 | 汽车、酒店、保险 | 请根据提供的图表,按收入从高到低对前 3 个垂直领域进行排名。 | 根据图表数据,按收入从高到低排名的前 3 个垂直领域为:
1. **Hospitality** ($13,400)
2. **Automotive** ($13,300)
3. **Insurance** ($12,300) | 我需要从图表中找出收入最高的三个垂直领域,并按从高到低排序。首先,我查看所有条形图上的数值标签,逐个比较收入金额。
我看到最高的几个数值是:
- Hospitality: $13400
- Automotive: $13500
- Insurance: $12300
- Retail: $10700
- Healthcare: $10500
等等,让我重新仔细查看。Automotive 是 $13500,Hospitality 是 $13400,Insurance 是 $12300。所以排序应该是:
1. Automotive ($13500)
2. Hospitality ($13400)
3. Insurance ($12... | bar | hard | hard_many_0104__q2 | hard/many_categories; procedural gen (seed=777, idx=104); correct-by-construction; style=minimal | # Constraints
The question you must answer is from a data-analysis-visualization domain. You are a data analyst specializing in business intelligence. You are an expert at extracting insights from visual charts and performing quantitative comparisons to identify top-performing sectors. Your precision ensures accurate r... | synthetic | train | rank_order | true | |
How much total revenue did LATAM generate? | $5400 | Based on the provided chart titled 'Regional Revenue by Product', calculate the total revenue generated by the LATAM region. To do this, sum the revenue values for all three product categories (Software, Services, and Hardware) specifically for the LATAM column. | To calculate the total revenue for the LATAM region, we sum the values for the three product categories shown in the stacked bar chart:
* **Software (Blue):** The label indicates **$1800**.
* **Hardware (Grey):** The label indicates **$3000**.
* **Services (Orange):** There is no direct label, so we derive this ... | Looking at the chart, I need to find the total revenue for the LATAM region by summing up the three product categories: Software, Services, and Hardware.
First, I'll identify the values for each segment in the LATAM column:
- The blue segment (Software) has a label showing $1800
- The grey segment (Hardware) has a lab... | stacked_bar | medium | syn_stacked_0306__q3 | annotated stacked bars; procedural gen (seed=45, idx=206); style=spreadsheet | # Constraints
The question you must answer is from a data-analysis-visualization domain. You are a Business Intelligence Analyst experienced in data visualization. You specialize in interpreting stacked bar charts and synthesizing financial data to provide accurate regional performance summaries for corporate stakehold... | synthetic | train | aggregation_sum_avg | true | |
هل زادت الإيرادات أم انخفضت من أكتوبر إلى نوفمبر؟ | زادت | بالنظر إلى الرسم البياني المرفق الذي يعرض "الإيرادات الشهرية - النصف الثاني من عام 2024"، قم بتحليل البيانات لتحديد ما إذا كانت الإيرادات قد زادت أم انخفضت خلال الفترة من شهر أكتوبر إلى شهر نوفمبر. يرجى تقديم إجابة مباشرة توضح اتجاه التغيير (زيادة أو انخفاض) بناءً على القيم الظاهرة في الرسم. | زادت | أرى أن السؤال يطلب تحديد اتجاه التغيير في الإيرادات من أكتوبر إلى نوفمبر بناءً على الرسم البياني.
الرسم البياني يعرض "الإيرادات الشهرية - النصف الثاني من عام 2024" مع نقاط بيانات لكل شهر من يوليو إلى ديسمبر.
بالنظر إلى القيم:
- أكتوبر: $7900
- نوفمبر: $8500
القيمة زادت من 7900 إلى 8500، وهذا يمثل زيادة واضحة.
السؤا... | line | easy | syn_line_0336__q3 | annotated line; procedural gen (seed=43, idx=236, trend=up); style=salmon | # Constraints
The question you must answer is from a data-analysis-visualization domain. You are a data analyst with expertise in financial reporting. You are skilled at interpreting line charts and trend data to provide precise business insights. Your sensibility is focused on accuracy and quantitative comparison to h... | synthetic | train | trend_direction | true | |
NA 产生的总收入是多少? | 6600 美元 | 请根据提供的图表,计算并回答:NA(北美)地区产生的总收入是多少?
图表标题:Regional Revenue by Product
图表类型:堆叠柱状图
X轴:地区(LATAM, NA, EMEA, APAC)
Y轴:收入(美元)
图例:
- 黑色:Software
- 红色:Services
- 深蓝色:Hardware
NA 柱状图各部分数值:
- Software: $2200
- Services: $2500
- Hardware: $1900
请将三部分相加得出 NA 地区的总收入。 | 根据图表,NA(北美)地区的总收入为各产品类别之和:
$2200 (Software) + $2500 (Services) + $1900 (Hardware) = $6600
Answer: $6600 | 我需要计算NA地区的总收入。首先,我看到这是一个堆叠柱状图,显示了不同地区各产品线的收入。
对于NA地区,我需要把三个部分加起来:
- 黑色部分(Software):$2200
- 红色部分(Services):$2500
- 深蓝色部分(Hardware):$1900
计算总和:2200 + 2500 + 1900 = 6600
所以NA地区的总收入是$6600。
Answer: $6600 | stacked_bar | medium | syn_stacked_0252__q3 | annotated stacked bars; procedural gen (seed=45, idx=152); style=bold | # Constraints
The question you must answer is from a data-analysis-visualization domain. You are a business data analyst experienced in interpreting corporate financial dashboards. You possess a keen eye for detail in stacked bar charts and are skilled at aggregating segmented data to provide accurate total revenue fig... | synthetic | train | aggregation_sum_avg | true | |
De la S5 à la S6, les inscriptions ont-elles augmenté ou diminué ? | Inchangé | En vous basant sur le graphique fourni, analysez les données pour déterminer si le nombre d'inscriptions a augmenté ou diminué entre la semaine 5 (S5) et la semaine 6 (S6). Veuillez justifier votre réponse en citant les valeurs exactes affichées sur le graphique pour ces deux périodes. | Le nombre d'inscriptions est resté stable entre la semaine 5 et la semaine 6, avec 1100 inscriptions pour chaque période. | Le graphique montre les inscriptions hebdomadaires pour le premier trimestre. Pour la semaine 5 (W5), la valeur indiquée est 1100. Pour la semaine 6 (W6), la valeur est également 1100. Puisque les deux valeurs sont identiques, il n’y a ni augmentation ni diminution — le nombre d’inscriptions est resté stable.
Answer: ... | line | easy | syn_line_0227__q3 | annotated line; procedural gen (seed=43, idx=127, trend=flat); style=spreadsheet | # Constraints
The question you must answer is from a data-analysis-visualization domain. You are a Data Analyst with expertise in business intelligence and reporting. You are skilled at interpreting line charts and quantitative trends to provide clear, evidence-based answers. Your precision ensures that data points are... | synthetic | train | trend_direction | true | |
¿Fueron los ingresos de Tech más altos en el tercer o en el cuarto trimestre? | Cuarto trimestre | Basándote en el gráfico proporcionado, determina si los ingresos del vertical 'Tech' fueron más altos en el tercer trimestre (Q3) o en el cuarto trimestre (Q4). Compara las barras correspondientes y proporciona la respuesta definitiva. | En el vertical 'Tech', los ingresos de Q3 fueron de $7500 y los de Q4 de $7900. Por lo tanto, los ingresos fueron más altos en el cuarto trimestre (Q4).
Answer: Q4 | El gráfico muestra dos barras para el vertical 'Tech': la azul (Q3) con $7500 y la roja (Q4) con $7900. Comparando ambos valores, Q4 es mayor. La pregunta pide determinar en qué trimestre fueron más altos los ingresos, y la respuesta debe ser el nombre del trimestre según las etiquetas del gráfico.
Answer: Q4 | grouped_bar | medium | syn_grouped_0270__q3 | annotated grouped bars; procedural gen (seed=44, idx=170); style=salmon | # Constraints
The question you must answer is from a data-analysis-visualization domain. You are a business data analyst experienced in interpreting financial dashboards. You possess a keen eye for detail in data visualization and can accurately extract and compare quantitative values from charts to provide precise bus... | synthetic | train | multi_series_compare | true | |
Clasifique los 3 segmentos inferiores por ingresos. | Gobierno, Consumidor, Empresa | Clasifique los 3 segmentos inferiores por ingresos, basándose en los datos de ingresos por segmento del año fiscal 2021 que se muestran en el gráfico adjunto. | **Step 1 — Compare**
- **Content accuracy & completeness**:
All responses correctly identify the three lowest-revenue segments: Government, Consumer, Enterprise. Response 3 adds context by noting Mid-Market is excluded (highest), which is accurate but not required. Responses 0 and 1 include dollar values; Response... | Looking at the bar chart titled "FY2021 Revenue by Segment", I see four segments listed on the x-axis: Enterprise, Mid-Market, Consumer, and Government. The y-axis shows revenue in dollars, with gridlines every 1000 units.
I need to identify the three segments with the lowest revenue. Reading the values from the top o... | bar | medium | syn_bar_0138__q4 | annotated bars; procedural gen (seed=42, idx=38); style=minimal | # Constraints
The question you must answer is from a data-analysis-visualization domain. You are a Business Intelligence Analyst specializing in data visualization and financial reporting. You are an expert at interpreting bar charts and extracting key performance indicators to provide clear, ranked summaries of busine... | synthetic | train | rank_order | true | |
Quel était le chiffre d'affaires de NA en 2023 ? | 9 000 $ | En vous basant sur le graphique fourni, quel était le chiffre d'affaires de la région NA en 2023 ? | Le chiffre d'affaires de la région NA en 2023 était de 9000 $. | Je regarde le graphique intitulé "Revenue by Region". Je repère la catégorie "NA" sur l'axe des abscisses. Ensuite, j'identifie la barre correspondant à l'année 2023 selon la légende (la première barre du groupe, couleur bleu foncé). Au-dessus de cette barre, la valeur est explicitement indiquée : $9000. Je vérifie que... | grouped_bar | hard | hard_simcol_0040__q1 | hard/similar_colors; procedural gen (seed=777, idx=40); correct-by-construction; style=neutral | # Constraints
The question you must answer is from a data-analysis-visualization domain. You are a Business Intelligence Analyst fluent in French and English. You specialize in interpreting corporate financial charts and extracting specific data points to provide accurate business reports. Your expertise allows you to ... | synthetic | train | lookup_value | true | |
De quel pourcentage le chiffre d'affaires a-t-il varié entre septembre et novembre ? | 9,1 % | En vous basant sur le graphique fourni, calculez le pourcentage de variation du chiffre d'affaires entre les mois de septembre et novembre. Veuillez détailler les étapes de votre calcul. | Pour calculer le pourcentage de variation du chiffre d'affaires entre septembre et novembre :
1. Revenu en septembre : 6 600 $
2. Revenu en novembre : 7 200 $
3. Différence : 7 200 $ - 6 600 $ = 600 $
4. Calcul : (600 / 6 600) × 100 ≈ 9,09 %
Answer: 9,09 % | Je dois calculer le pourcentage de variation du chiffre d'affaires entre septembre et novembre. D'abord, je lis les valeurs sur le graphique : en septembre, le revenu est de 6600 $, et en novembre, il est de 7200 $. La différence est donc 7200 - 6600 = 600 $. Pour le pourcentage de variation, je divise cette différence... | line | medium | syn_line_0224__q4 | annotated line; procedural gen (seed=43, idx=124, trend=flat); style=neutral | # Constraints
The question you must answer is from a math domain. You are a financial analyst with a strong background in quantitative analysis. You excel at extracting data from visual charts and performing precise percentage change calculations. Your expertise allows you to provide accurate business growth metrics ba... | synthetic | train | percent_change_ratio | true | |
Combien de revenus en plus Direct a-t-il générés par rapport à Online ? | 5400 $ | En vous basant sur le graphique fourni, calculez la différence de revenus entre le canal "Direct" et le canal "Online" pour le deuxième trimestre (Q2). Indiquez le montant exact en dollars que "Direct" a généré en plus par rapport à "Online". | Le revenu du canal "Direct" est de 8 300 $ et celui du canal "Online" est de 2 900 $. La différence est de 5 400 $. | Je regarde le graphique intitulé "Q2 Revenue by Channel". Je repère les barres correspondant aux canaux "Direct" et "Online". La barre "Direct" affiche une étiquette de valeur de $8300. La barre "Online" affiche une étiquette de valeur de $2900. Je dois calculer la différence entre ces deux montants : 8300 - 2900. Cela... | bar | medium | syn_bar_0107__q3 | annotated bars; procedural gen (seed=42, idx=7); style=spreadsheet | # Constraints
The question you must answer is from a data-analysis-visualization domain. You are a Business Intelligence Analyst expert in data visualization. You have a keen eye for extracting precise values from charts and calculating performance metrics. You are ideally placed to answer this because you can accurate... | synthetic | train | delta_absolute | true | |
¿Cuántos ingresos más generó Educación que Sin fines de lucro? | $1400 | Basado en el gráfico de barras adjunto titulado 'Q3 Revenue by Segment', calcula la diferencia de ingresos entre el segmento 'Education' y el segmento 'Nonprofit'.
Por favor, sigue estos pasos para obtener el resultado:
1. Identifica el valor de ingresos exacto para la categoría 'Education'.
2. Identifica el valor de ... | 1. Ingresos de 'Education': $10400
2. Ingresos de 'Nonprofit': $9000
3. Diferencia: $10400 - $9000 = $1400
La diferencia de ingresos es de $1400. | El segmento 'Education' tiene un ingreso de $10400, según la etiqueta sobre su barra. El segmento 'Nonprofit' muestra $9000. Restando: 10400 - 9000 = 1400. La diferencia es exacta y directamente legible del gráfico.
Answer: $1400 | bar | hard | hard_trunc_0009__q2 | hard/truncated_axis; procedural gen (seed=777, idx=9); correct-by-construction; style=bold | # Constraints
The question you must answer is from a data-analysis-visualization domain. You are a Business Data Analyst with expertise in financial reporting and data visualization. You are skilled at extracting quantitative information from charts and performing precise calculations to provide business insights. Your... | synthetic | train | delta_absolute | true | |
Le chiffre d'affaires du secteur manufacturier était-il plus élevé au premier ou au deuxième trimestre ? | T2 | En vous basant sur le graphique fourni, comparez les revenus du secteur manufacturier pour le premier trimestre (Q1) et le deuxième trimestre (Q2). Le chiffre d'affaires était-il plus élevé au premier ou au deuxième trimestre ? | Pour le secteur manufacturier, le chiffre d'affaires était de 4 800 $ au premier trimestre (Q1) et de 6 100 $ au deuxième trimestre (Q2). Il était donc plus élevé au deuxième trimestre. | Je dois analyser le graphique pour comparer les revenus du secteur manufacturier entre Q1 et Q2. Le graphique montre des barres bleues pour Q1 et orange pour Q2. Pour "Manufacturing", la barre bleue (Q1) atteint 4800 $, et la barre orange (Q2) atteint 6100 $. 6100 est supérieur à 4800, donc le revenu était plus élevé e... | grouped_bar | medium | syn_grouped_0318__q3 | annotated grouped bars; procedural gen (seed=44, idx=218); style=neutral | # Constraints
The question you must answer is from a data-analysis-visualization domain. You are a Business Intelligence Analyst with expertise in data visualization. You are skilled at interpreting financial charts and extracting specific metrics to provide accurate business insights. You are ideally placed to answer ... | synthetic | train | multi_series_compare | true |
Adaption Prism — adapted multilingual chart QA
The training set behind Prism, a LoRA for chart question answering across ten visual styles.
5,951 rows. Produced by running gridline-chartqa (3,803 hand-verified rows) through Adaption's Adaptive Data step with every recipe enabled — prompt rephrasing, metadata injection, deduplication, reasoning traces, hallucination mitigation, House Special — plus translation into four additional languages.
This is platform output, not hand-built gold data. Read the column notes below before using it. The clean source dataset is gridline-chartqa.
Languages
| language | rows | share |
|---|---|---|
| English | 3,639 | 61.1% |
| Arabic | 595 | 10.0% |
| Chinese (Simplified) | 593 | 10.0% |
| Spanish | 571 | 9.6% |
| French | 553 | 9.3% |
Answers were translated as well as questions. 1,143 rows have
non-ASCII answers — 服务, Éducation, Augmenté, 2700 دولار.
This matters: the chart images are rendered in English. A chart whose
bar is labelled "Services" may carry the answer 服务. The answer is a
correct translation of the correct category, but it no longer matches the
text visible in the image, so exact string matching against chart content
will fail on those rows. Anyone scoring against chart text should either
filter to English or normalise category names back to the image's
language.
Columns
| column | source | trustworthy as a label? |
|---|---|---|
question |
original, or platform translation | yes |
answer |
original, or platform translation | yes, with the caveat above |
enhanced_prompt |
platform rewrite | rewritten, not ground truth |
enhanced_completion |
platform rewrite | no — see below |
reasoning_trace |
platform-generated | explanatory only |
chart_type |
source | yes |
task_type |
source | yes |
difficulty |
source | yes |
notes |
source | yes — includes visual style and mechanic |
original_image |
source | URL, see below |
source, split, verified, response_constraints |
mixed | metadata |
On enhanced_completion. 93% of these diverge from the corresponding
answer. Mean length goes from 1.4 words to 31.8 — short exact answers
become paragraphs. A small number contain the platform's own
preference-judging scaffolding leaked into the field, e.g. text beginning
**Step 1 — Compare** | Dimension | Response 0 | Response 1. Treat this
column as a record of what the platform produced, not as labels.
On original_image. These are URLs pointing into
gridline-chartqa.
This dataset ships no images of its own and depends on that repo staying
public.
Underlying data
The source rows are 3,705 synthetic + 98 hand-authored.
Synthetic charts are rendered from seeded values, with answers computed before the image is drawn — labels never depend on reading the image. They span ten visual styles (newspaper graphics, spreadsheet defaults, journal figures, dark dashboards, dense analyst charts and others) varying colour, typography, figure geometry, title placement and grid treatment.
806 rows (21%) are perceptually hard by construction, across eight mechanics: truncated axes where bar heights misrepresent ratios, unlabeled charts with values snapped exactly onto gridlines, near-ties within 1–2%, near-identical series colours, 12–16 rotated categories, legends occluding the plot, log scales, and dual axes.
The 98 hand-authored rows come from real public dashboards — Statistics Canada, US Bureau of Labor Statistics, WHO, ECB, Bank of Canada, Climate Policy Database — each reviewed against its source figure.
Intended use
Training and evaluating short-answer chart QA, including cross-lingual settings where the question language differs from the chart language.
For clean labels, prefer gridline-chartqa. Use this one when you specifically want the multilingual rows or want to study what Adaptive Data does to a dataset.
Known limitations
- Answer/image language mismatch on translated rows, as above.
enhanced_completionis not ground truth — 93% divergence.- No images of its own — depends on the source repo.
- Synthetic rows come from one generator. Ten rendering styles, but a bounded set of domains, value distributions and question templates.
Provenance
Generation pipeline, style definitions and adversarial renderers: github.com/VinodAnbalagan/adaption-charts
Every synthetic row has a provenance JSON recording its seed and underlying values, so any answer can be recomputed from source.
Citation
@misc{anbalagan2026adaptionprism,
  title        = {Adaption Prism: Adapted Multilingual Chart QA},
  author       = {Anbalagan, Vinod},
  year         = {2026},
  howpublished = {\url{https://huggingface.co/datasets/vinod-anbalagan/adaption-prism}}
}
Please also credit the upstream chart sources listed above.
Platform training report
Generated by Adaption AutoScientist at export time — training configuration, win-rate chart and loss curves.

This dataset is a remastered version of this dataset prepared using Adaption's Adaptive Data platform.
adaption-Prism
This dataset contains verified chart question-answer pairs focused on business, finance, and policy domains. It combines programmatically generated synthetic data with a hand-authored hardset derived from real public dashboards. The content covers various chart types and task types, requiring reasoning to extract specific values, comparisons, and trends.
Dataset size
There are 5,951 data points in this dataset. This is an instruction tuning dataset.
Quality of Remastered Dataset
The final quality is B, with a relative quality improvement of 8.7%.
Domain
- Data-analysis-visualization (100%)
Language
- English (98%)
- Chinese (2%)
Tone
- Informative (48%)
- Analytical (32%)
- Objective (16%)
Evaluation Results
Quality Gains:
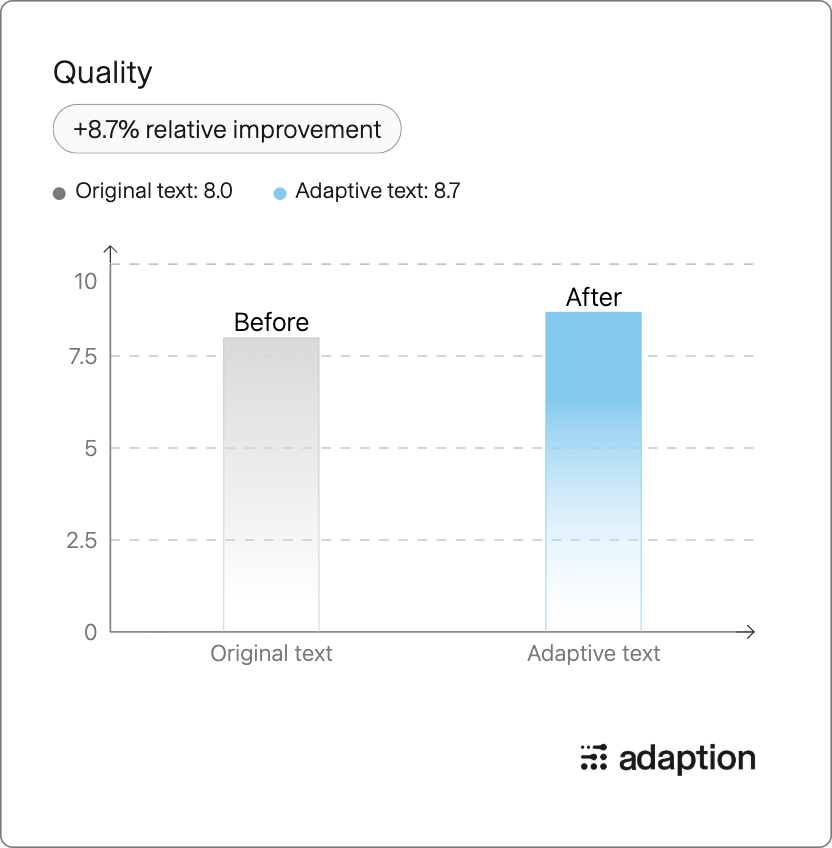
Grade Improvement:
Percentile Chart:
- Downloads last month
- 33